Sat, Apr 20, 2024
 20.12°C Kathmandu
Miscellaneous
The number game
The Public Service Commission has not been shying away from providing government data
bookmark 
Deepak Thapa
Published at : January 10, 2019
Updated at : January 10, 2019 10:01
At a time when disaggregation of any kind of government data along gender or caste/ethnic lines is generally frowned upon by the powers that be for the seemingly silly reason that they think it is not in the national interest to do so, it was pleasantly surprising to discover that at least one government institution has not been shying away from publicly providing such information—the Public Service Commission (PSC). Of course, that is partly because in its mandate to recruit the country’s civil servants, it has to follow the prescribed provision on reservations for specified sections of the population, which include gender and caste/ethnic groups. But, like many other government departments, it could have hemmed and hawed over the matter. Instead, since 2016-17, its annual reports have even begun providing full details of the socio-economic backgrounds of the successful applicants as well.
I was drawn to the PSC reports following some stories in these pages a while ago about the gender and caste/ethnic backgrounds of those who have been getting in. There is much more in the report than had been published.For, if, as the first home minister of independent India, SardarVallabhbhai Patel, said, the civil service is the steel frame on which the government rests, that is all the more reason to understand a little more about the kind of backgrounds of the people we will soon be dealing with.
Growing diversity
Unless otherwise stated, the figures presented here are from the PSC’s 2017-18 annual report. First off, there is the good news that women applicants are consistently beginning to outnumber males, which has been the case in three of the past four years. In 2017-18, women made up 52 percent of the 567,853 candidates for the 5,970 posts on offer. This figure is lower than their 60 percent share in 2014-15, but still a majority. The large number of women has partly to do with two positions that seem to be the domain of women only—staff nurses andauxiliary nurse midwives (the ubiquitous ANaMi); men made up less than 0.5per centof the nearly 60,000 applicants for those two posts.
Of course, offering candidature is one thing and actually succeeding another, and that is where the disadvantage of gender comes to the fore. Of the 7,718 individuals ‘recommended’ for intake into different government departments, only 32 percentwere women. (The PSC only has the authority to recommend someone for a job and it is up to the concerned government office to provide the appointment. At least one of the earlier PSC annual reports rued the dilly-dallying that goes on even after the recommendation has been made.)
Going by district, the highest number of candidates were from Saptari, at 4.6per cent, and the next 10 districts with the highest number of candidates are also from the Tarai. In terms of success though, Saptari stands fifth, accounting for 2.98 percent of those recommended. Sarlahi was at the top of this game with 3.43per cent, and most surprising was to see Jumla at second position, with 3.38 percent of those successful hailing from this remote district.
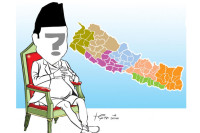
In terms of provincial breakdown, a quarter of the candidates were from Province 2, but only a fifth of them were successful. The biggest gainer was the recognised backward region, Province 6, now named Karnali, which was home to 9 percent of the candidates but 13 percent of those successful while containing only 6 percent of the national population. Province 3, with the capital region and 21 percent of the national population, sent only 12 percent of the candidates and an even lower 11 percent of those successful.
It is telling of our educational system that 91per centof the candidates were over-qualified for the jobs they had applied for, meaning, they had a degree more advanced than the minimum required. The academic background of 55 percent of the candidates was education, medical/health science (remember, the staff nurses and the ANaMi) and management. Interestingly, unlike in the past when the civil service was dominated by those from the Sanskrit stream, only 0.1 percent of the candidates came from such a background. There was no information about the educational background of the successful candidates, but the report did mention that 58 percent of them had secured first division in the minimum degree required for the job, 35per cent, second division, and 7per cent, third division.
As for the education levels of the parents of the candidates, nearly 53 percent of the fathers and 48 percent of the mothers were functionally literate. As for the rest, however, there was a stark difference, with 26 percent of the fathers and 7 percent of the mothers with education levels of SLC and above, while a full 45 percent of the mothers were illiterate compared to only 21percent of the fathers. Among the successful candidates, those with fathers and mothers with education levels higher than SLC, the success rate mirrored the proportion of candidates. Astounding was that 53 percent of those recommended for entry into government jobs had illiterate mothers.
Agriculture was the main source of livelihood for 79 percent of the parents/guardians of the successful candidates, followed by government service,8per cent, teaching,9 percent, and own business,2per cent, among the major professions.
Not hogging seats
The caste/ethnic breakdown shows the dominance of the major population groups, particularly of Bahuns and Chhetris. The last two make up 26.5 percent and 17.4 percent of the candidates, followed by Tharu, 7 percent, Magar, 6.3 percent, and Yadav, 6.2 percent. In terms of success, 33.4 percent were Bahuns, 20per cent Chhetris, 5.5percent Magars, and 5.2 percent each Tharus and Yadavs. Two points to note here though. First, Newars, a mainstay of the Nepali bureaucracy till recently, numbered only 4.1 percent among the candidates and 3.8 percent among those recommended. Second, since the figures for those recommended also include promotions and internal competition, and since the bureaucracy has long been the preserve of Bahuns and Chhetris, it is not surprising that their success rate far exceeds the proportion of candidates from these two groups.
A final point about those who come through the reserved seats. One of the fears expressed early on was that it would be the more advanced groups among the different clusters that would hog the seats set aside for them. One scenario often used was that Newars would gobble up all the Janajati seats. The actual evidence is somewhat different though, and encouraging. Among the Janajatis with their classification among five groups based on their socio-economic status, the ‘advantaged’ (consisting of Newars and Thakalis) could take only 16.7 percent of the seats reserved for Janajatis, the ‘disadvantaged’ took46.6per cent, the ‘marginalised’, 34per cent, the ‘highly marginalised’, 2.5per cent, and the endangered, 0.2per cent. Similar breakdowns were not available for the other groups eligible for reservations, although I was struck by eight individuals who were listed as ‘Adivasi Janajati Dalit’. That was new to me.
Deepak Thapa
Deepak Thapa has been a fortnightly columnist with The Kathmandu Post since 2009, writing on a range of topical social and political issues.


Editor's Picks

E-PAPER | April 20, 2024
×